Deploying Spring PetClinic Microservices on AWS EKS — A Complete End-to-End Guide
How to deploy Spring PetClinic Microservices on AWS EKS using Terraform and Helm — with real bugs and fixes

Introduction
If you've been learning cloud and DevOps, you've probably heard terms like microservices, Kubernetes, and EKS thrown around constantly. But understanding them in theory is very different from actually deploying a real application end to end.
In this blog, I'll walk you through exactly what I did — deploying the Spring PetClinic Microservices application on AWS Elastic Kubernetes Service (EKS) — covering every step, every command, every mistake I made, and how I fixed them.
What is Spring PetClinic?

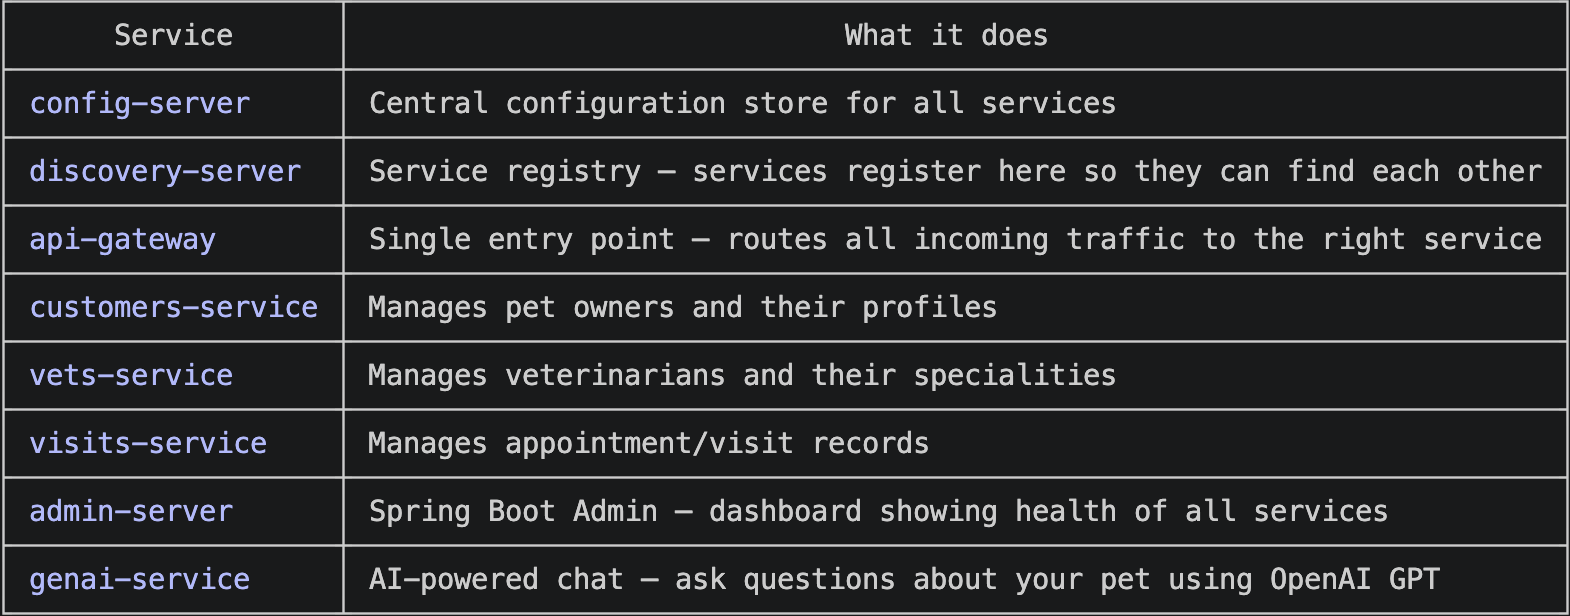
Spring PetClinic is a sample application built by the Spring team at VMware to demonstrate best practices in Spring Boot development. The microservices version breaks the monolith into 8 independent services that communicate over a network — each with its own responsibility:
What Did I Deploy?
Locally — all 8 services running with Docker Compose on my MacBook
On AWS — all 8 services running on a 2-node EKS cluster, accessible via a public AWS Application Load Balancer URL
GenAI — connected the AI chat service to OpenAI GPT-4o-mini so you can ask "Does George Franklin's cat Leo have any upcoming visits?"
Why This Project?
Most tutorials show you one service, one container, one deployment. Real-world applications don't work that way.
I chose this project because it forced me to understand:
How multiple services talk to each other
Why startup order matters in distributed systems
How to manage secrets (API keys) safely in Kubernetes
How to use Infrastructure as Code (Terraform) instead of clicking around the AWS console
How to monitor a live system with real observability tools
If you can deploy this, you can deploy almost anything.
Architecture Overview
Here's how the pieces fit together on AWS:
Internet
    │
    ▼
AWS ALB (Application Load Balancer)
    │
    ▼
EKS Cluster (2x t3.medium nodes)
    │
    ├── api-gateway          ← all traffic enters here
    ├── customers-service    ← talks to MySQL
    ├── vets-service         ← talks to MySQL
    ├── visits-service       ← talks to MySQL
    ├── genai-service        ← talks to OpenAI API
    ├── config-server        ← all services pull config from here
    ├── discovery-server     ← all services register here
    └── admin-server         ← monitors all services
Supporting:
    ├── Amazon ECR           ← Docker image registry
    ├── Amazon RDS / MySQL   ← database (deployed in-cluster)
    ├── Prometheus           ← metrics scraping
    └── Grafana              ← metrics dashboards
Prerequisites
Before starting, make sure you have these tools installed:
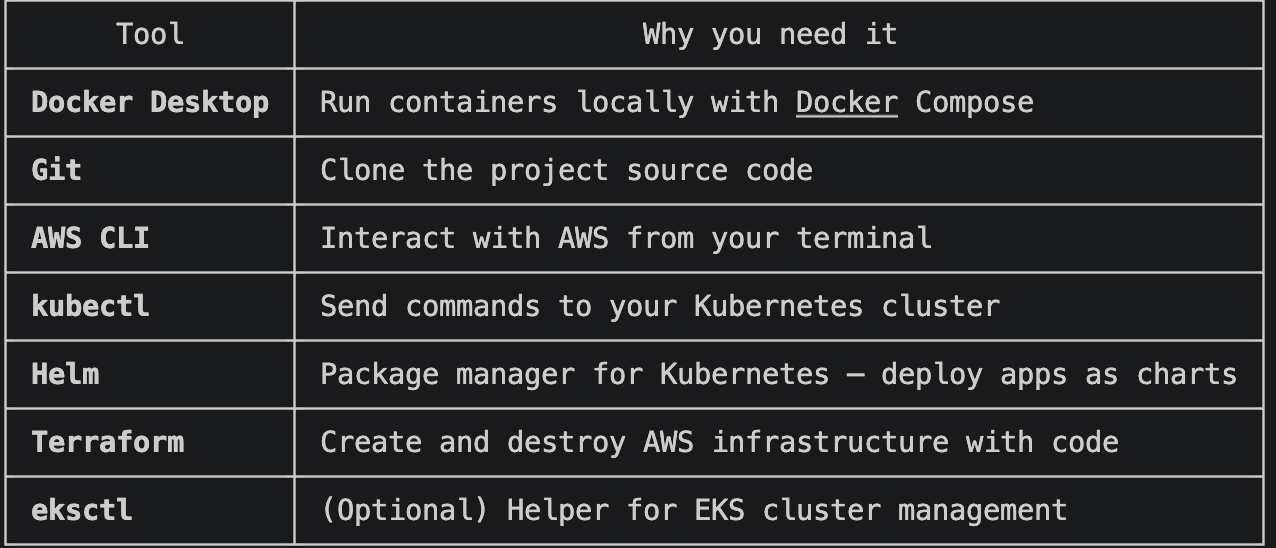
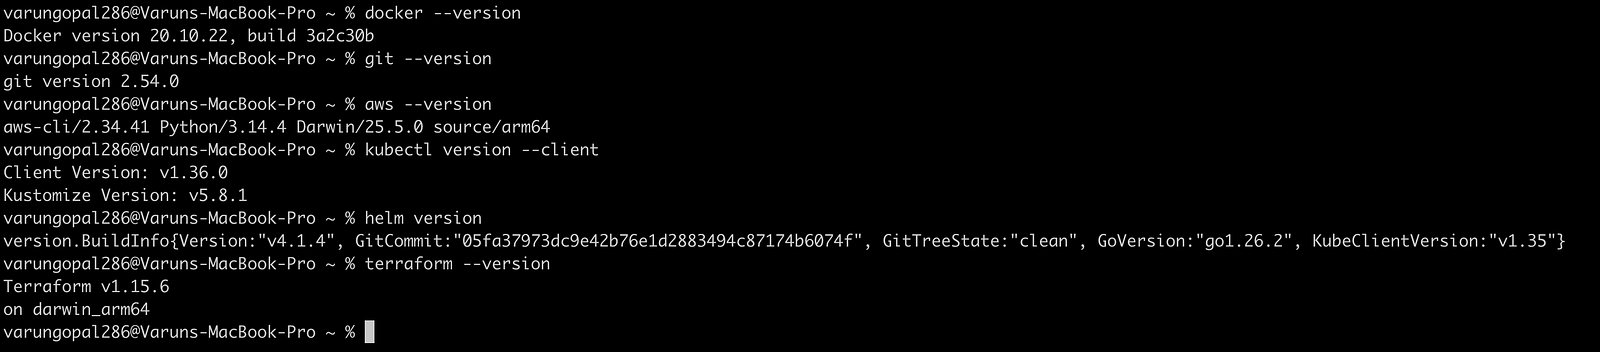
Verify everything is installed:
docker --version
git --version
aws --version
kubectl version --client
helm version
terraform --versionConfigure AWS credentials:
Configure AWS credentials:
aws configure
# Enter your Access Key ID, Secret Access Key, region (ap-south-1), output format (json)
Verify your AWS identity:
aws sts get-caller-identity
Expected output:
{
    "UserId": "AIDXXXXXXXXXXXXXXXXX",
    "Account": "XXXXXXXXXXXXXXXXX",
    "Arn": "arn:aws:iam::XXXXXXXXXXXXXXXXX:user/terraform-user"
}
Step 1: Clone and Run Locally with Docker Compose
Clone the Repository
git clone https://github.com/varungopal286/spring-petclinic-microservices.git
cd spring-petclinic-microservices
Set Up Environment Variables
The GenAI service needs an OpenAI API key. Create a .env file at the project root:
touch .env
Add the following inside .env:
OPENAI_API_KEY=your-openai-api-key-here
AZURE_OPENAI_KEY=
AZURE_OPENAI_ENDPOINT=
🔒 Security note: This .env file is in .gitignore and will never be pushed to GitHub. Your API key stays on your machine only.
Apple Silicon (M1/M2/M3) Users — Important
The Docker images are built for AMD64 (Linux servers). Apple Silicon Macs run ARM64. Set this before running anything:
export DOCKER_DEFAULT_PLATFORM=linux/amd64
Start All Services
docker compose up -d
Docker will pull all 8 images and start them in dependency order. This takes 3–5 minutes on first run.
Verify Everything is Running
docker ps
You should see 11 containers running (8 services + Zipkin + Prometheus + Grafana).
docker compose ps
All services should show Up status. Config-server and discovery-server will show healthy.
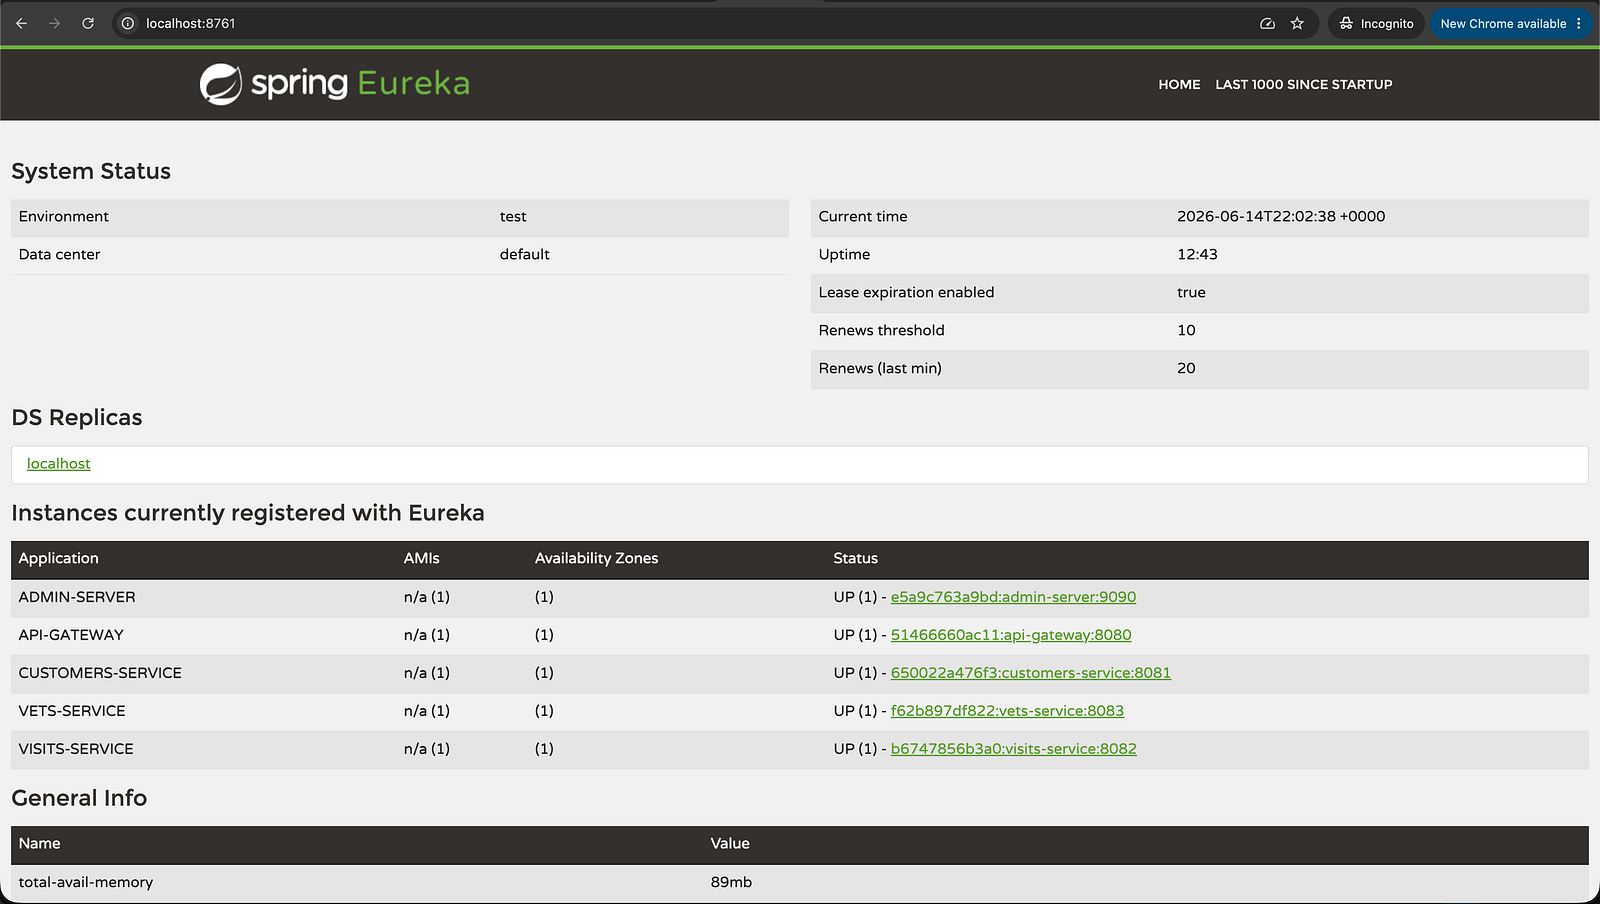
Access the Application
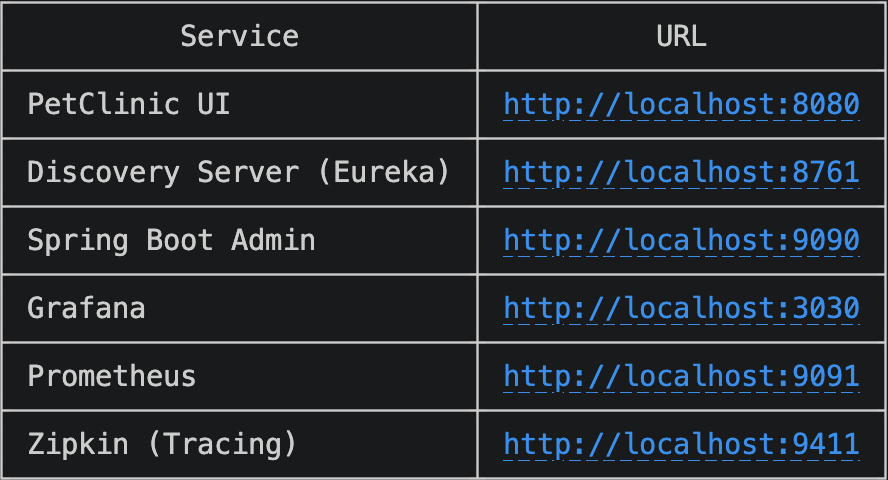
http://localhost:8761 — Eureka showing all services registered
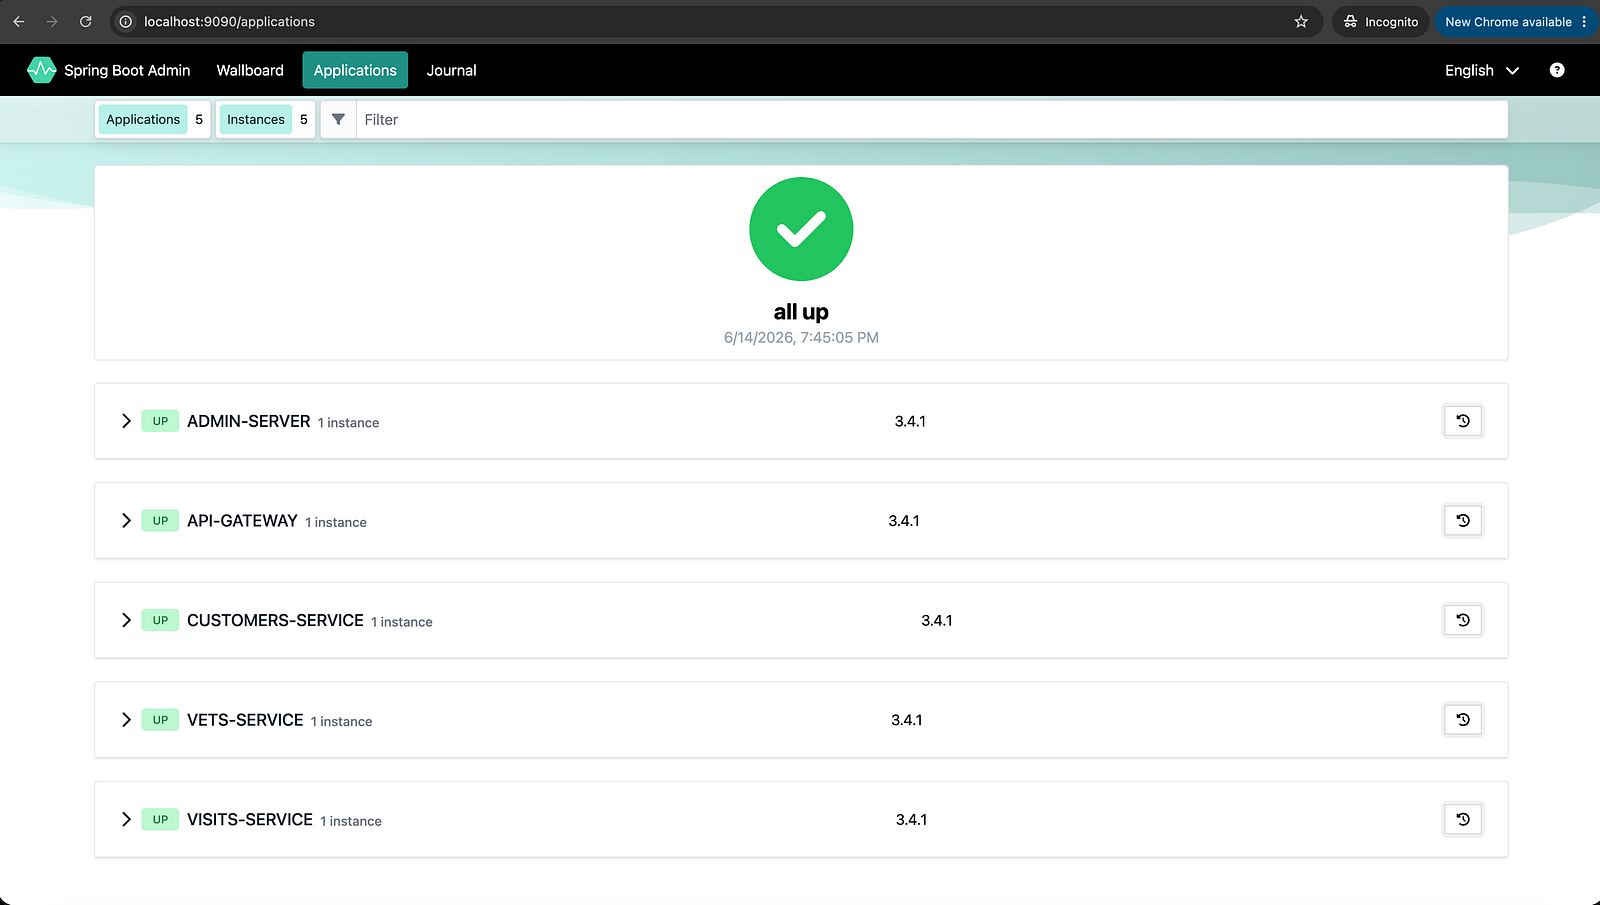
http://localhost:9090 — Spring Boot Admin showing all services UP (green)
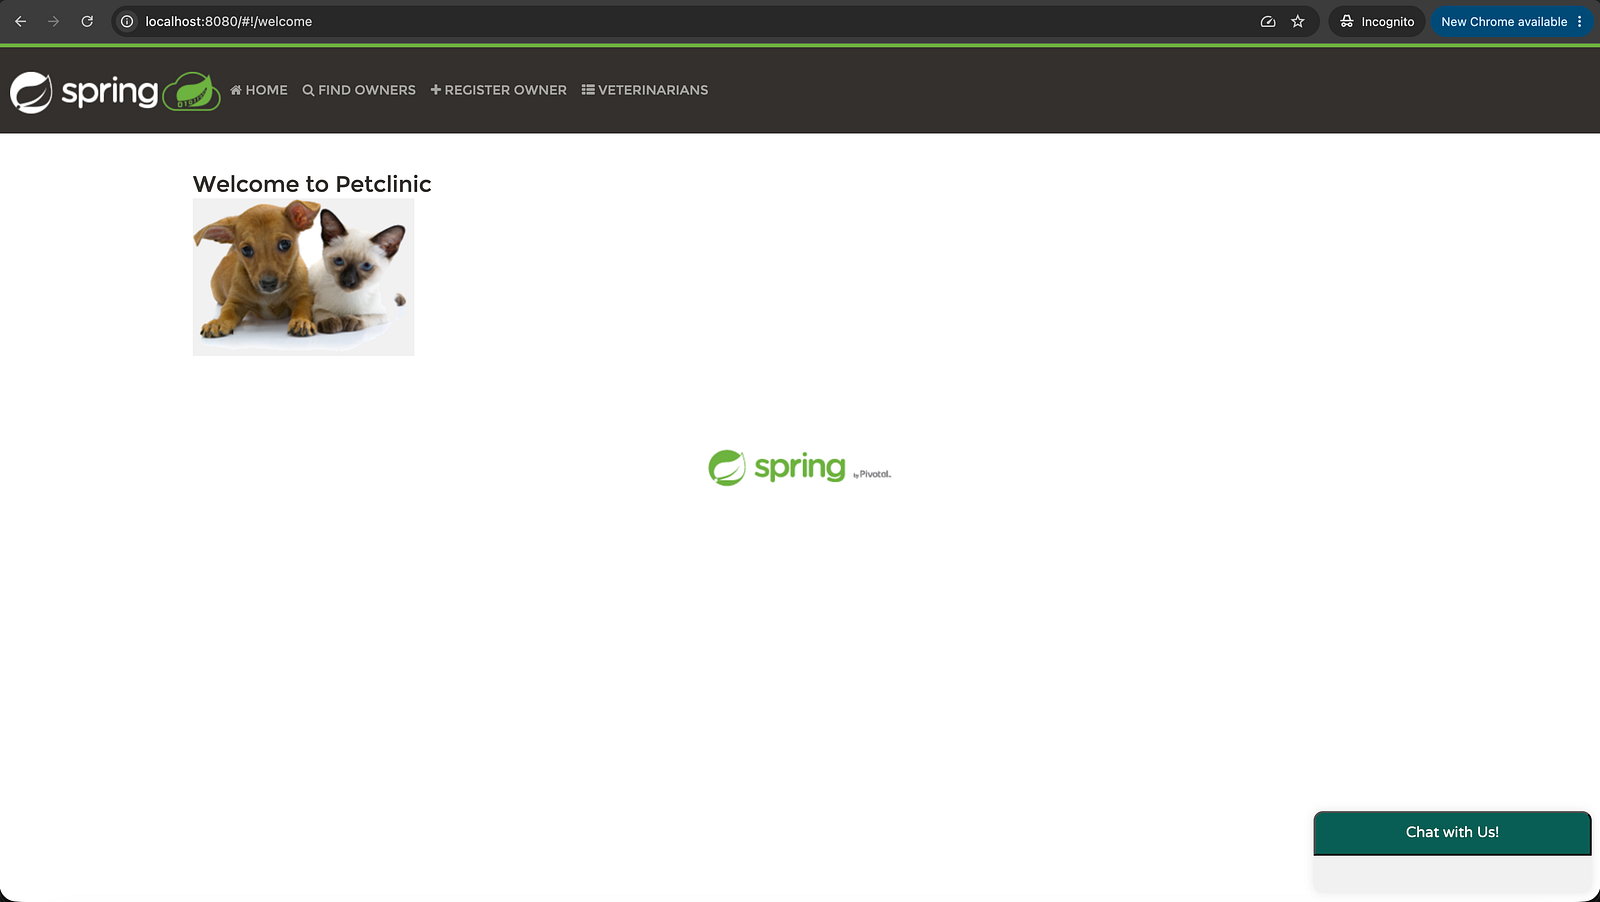
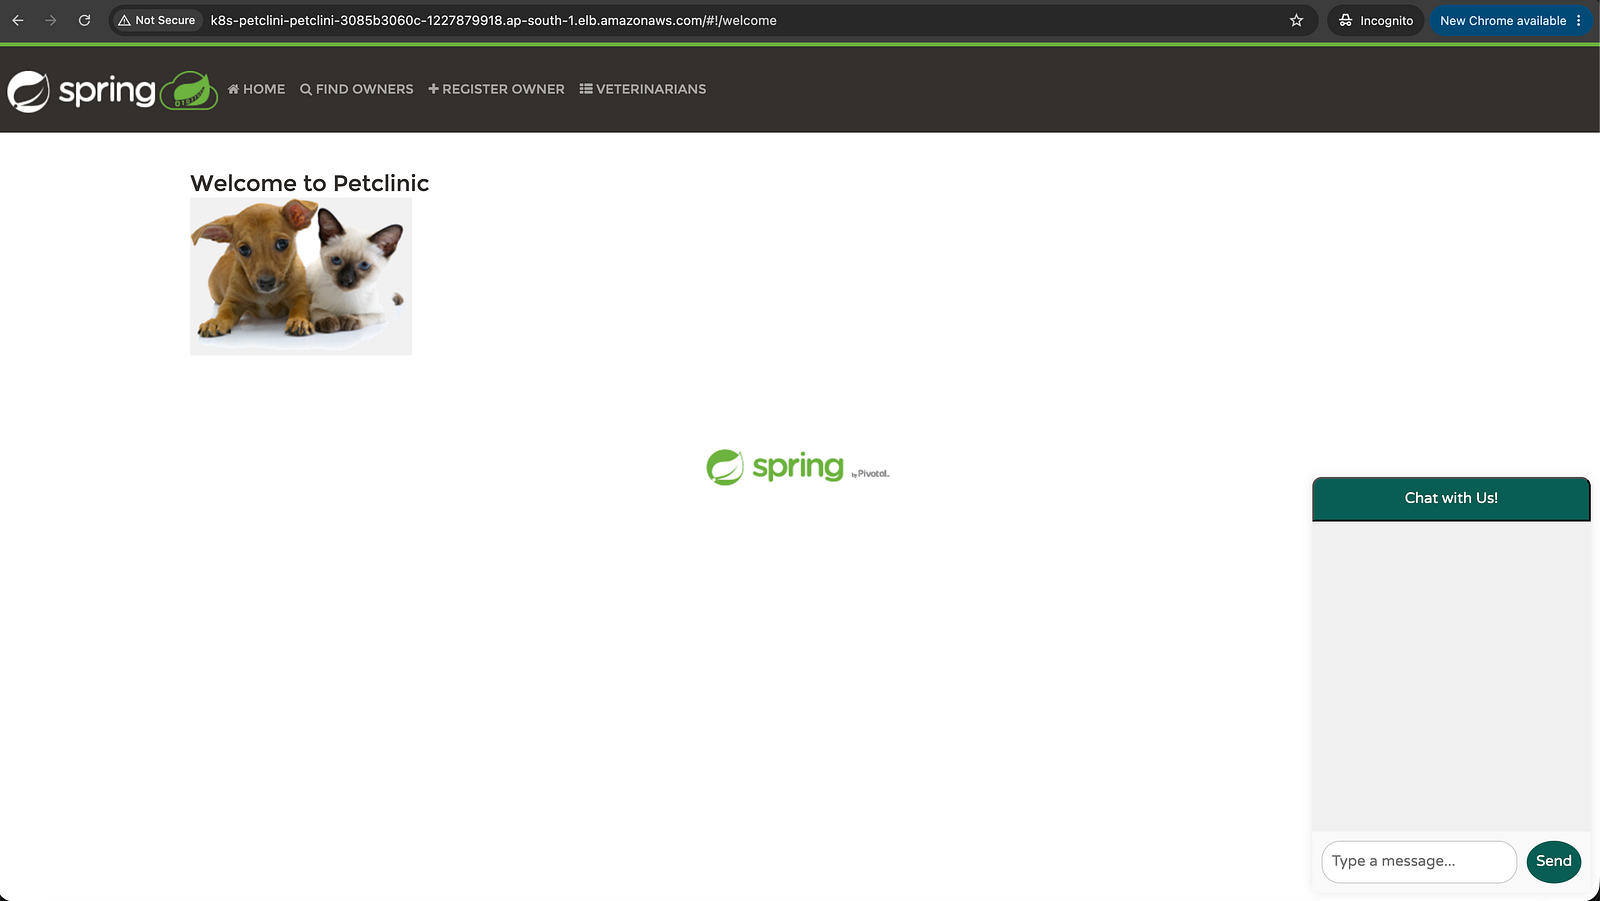
Spring PetClinic UI homepage showing the Welcome page at http://localhost:8080
Step 2: The Startup Order — Why Config Server Goes First
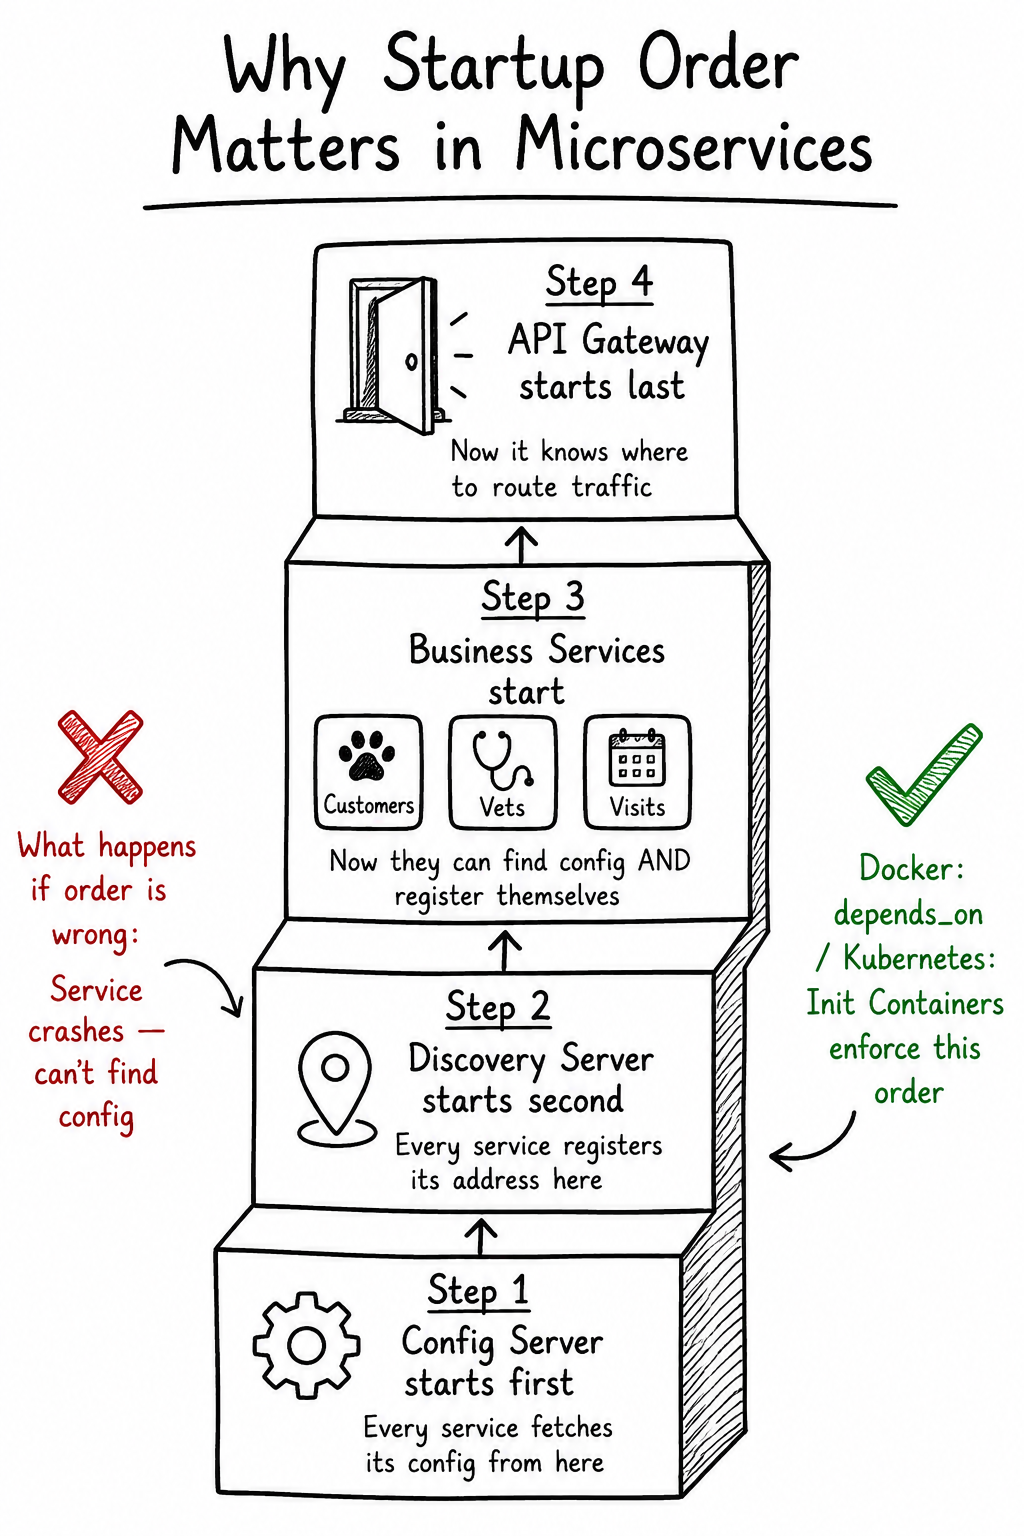
This was one of the most important things I learned from this project.
Every microservice in this app needs to:
Fetch its configuration from config-server on startup Register itself with discovery-server so other services can find it
If customers-service starts before config-server is ready, it crashes immediately because it can't load its config. If api-gateway starts before discovery-server, it can't route traffic because there's nothing registered.
How Docker Compose Handles This
In docker-compose.yml, each service has a depends_on block:
customers-service:
  depends_on:
    config-server:
      condition: service_healthy
    discovery-server:
      condition: service_healthy
service_healthy means Docker waits until the healthcheck passes — not just until the container starts, but until the service is actually responding.
Config-server's healthcheck:
healthcheck:
  test: ["CMD", "curl", "-I", "http://config-server:8888"]
  interval: 5s
  timeout: 5s
  retries: 10
How Kubernetes Handles This (Init Containers)
On EKS, Docker Compose's depends_on doesn't exist. Instead, the Helm chart uses init containers — small containers that run before the main app starts and block until a TCP connection succeeds:
initContainers:
  - name: wait-config
    image: busybox:1.35
    command:
      - sh
      - -c
      - |
        until nc -z config-server 8888; do
          echo "Waiting for config-server..."
          sleep 5
        done
The pod won't start its main container until this init container exits successfully. This guarantees startup order on Kubernetes just like depends_on does on Docker Compose.
Step 3: AWS Infrastructure with Terraform
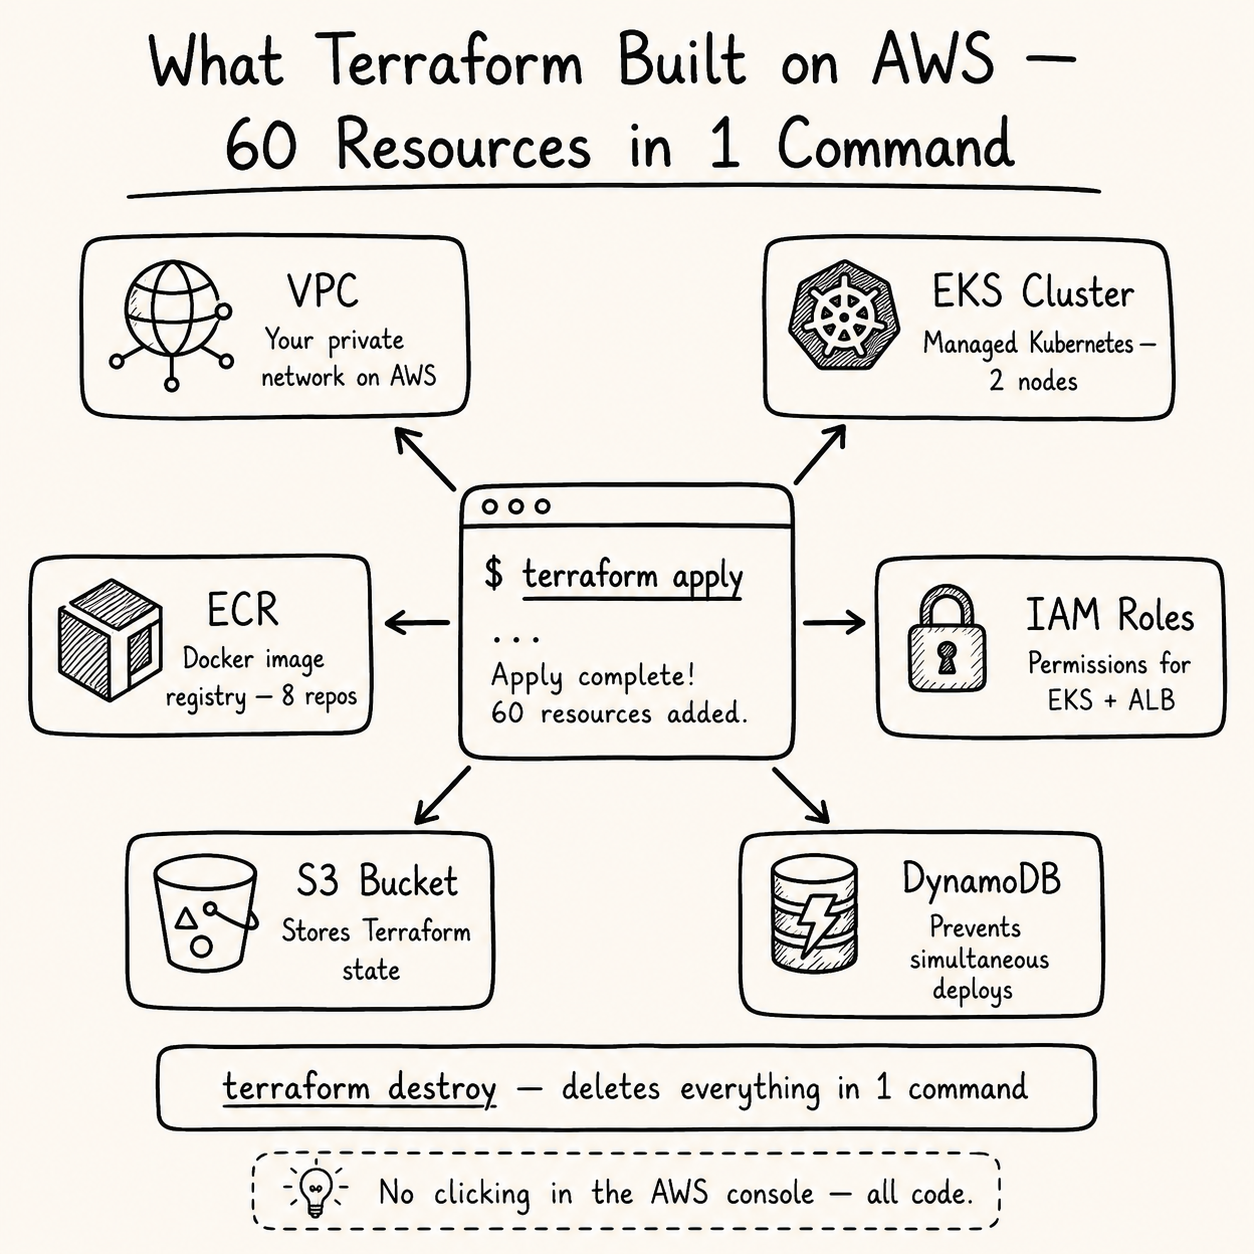
Instead of clicking through the AWS console, all infrastructure is defined as code using Terraform. This means:
The entire infrastructure can be created with one command
It can be destroyed with one command (no orphaned resources costing money)
It can be version-controlled and reviewed like code
What Terraform Creates
terraform/
├── vpc.tf          → VPC, 3 public + 3 private subnets, NAT Gateway, IGW
├── eks.tf          → EKS cluster, managed node group (2x t3.medium)
├── ecr.tf          → ECR repositories for all 8 Docker images
├── iam.tf          → IAM roles for EKS nodes and ALB controller (IRSA)
├── backend.tf      → S3 remote state + DynamoDB locking
└── variables.tf    → Region, cluster name, node size
Remote State Backend
Terraform state is stored in S3 (not locally) so it's safe, shareable, and backed up:
terraform {
  backend "s3" {
    bucket         = "petclinic-tfstate-721449410291"
    key            = "petclinic/terraform.tfstate"
    region         = "ap-south-1"
    dynamodb_table = "petclinic-terraform-locks"
    encrypt        = true
  }
}
DynamoDB prevents two people from running terraform apply at the same time (state locking).
Deploy the Infrastructure
cd terraform
terraform init
terraform plan    # review what will be created — 60 resources
terraform apply   # type 'yes' when prompted
This takes about 15–20 minutes. EKS cluster creation is the slowest part.
Expected output:
Apply complete! Resources: 60 added, 0 changed, 0 destroyed.
Outputs:
cluster_name = "petclinic-cluster"
configure_kubectl_command = "aws eks update-kubeconfig --name petclinic-cluster --region ap-south-1"
ecr_registry = "721449410291.dkr.ecr.ap-south-1.amazonaws.com"
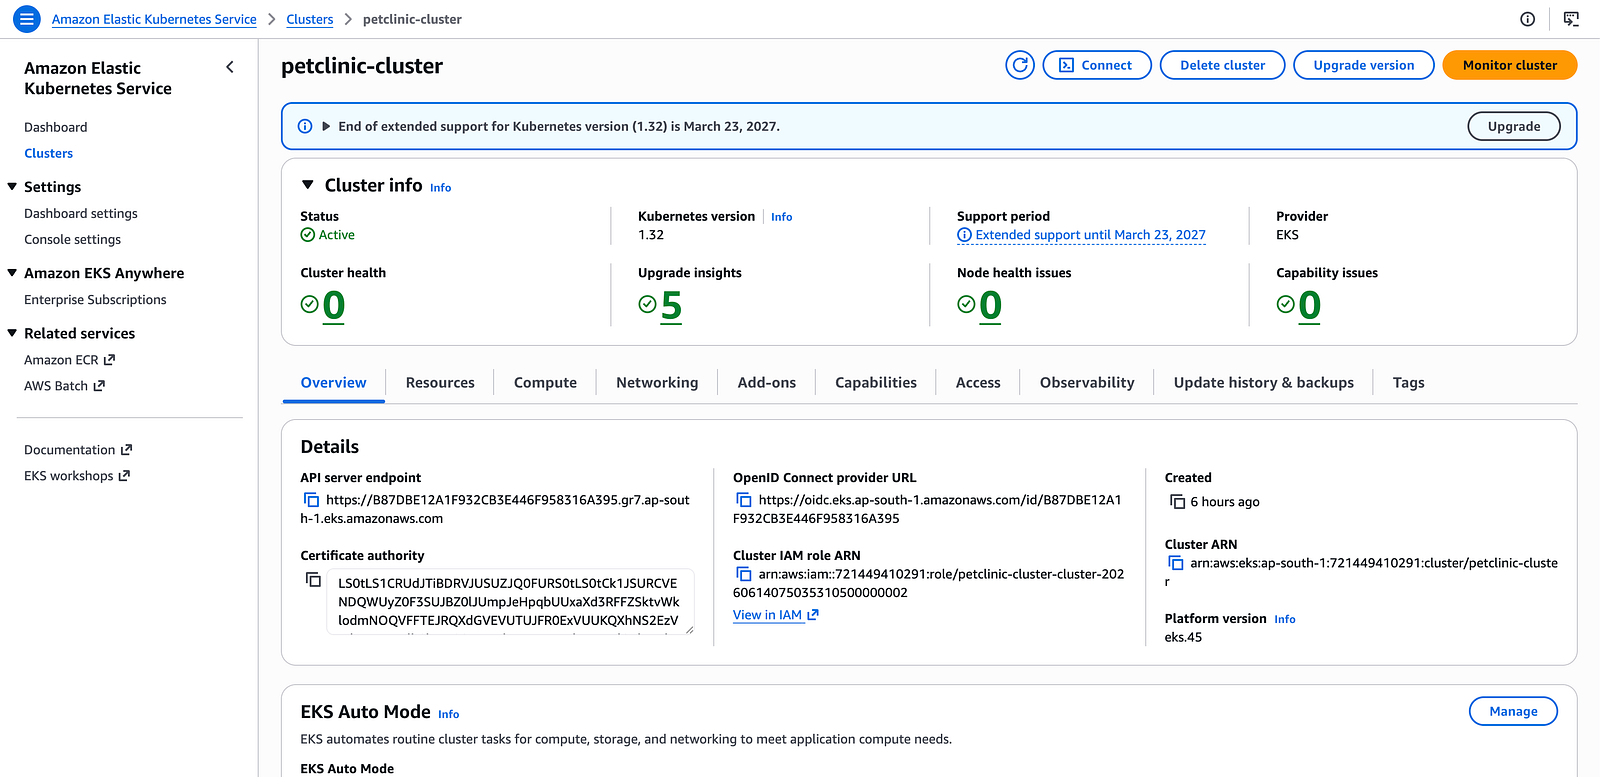
Connect kubectl to the Cluster
aws eks update-kubeconfig --name petclinic-cluster --region ap-south-1
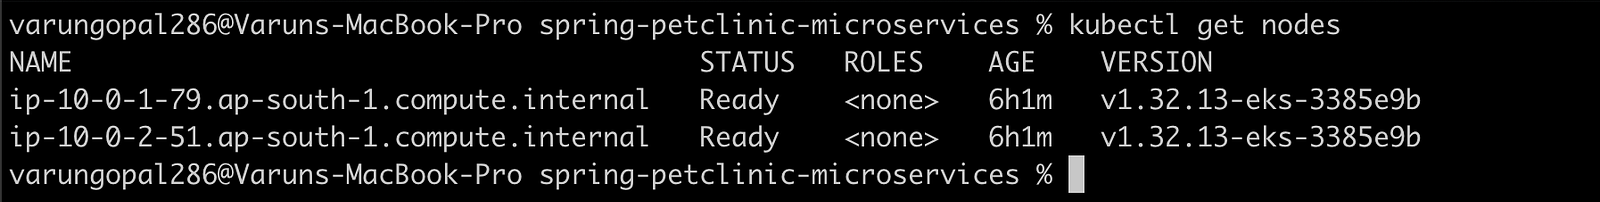
kubectl get nodes
Expected output:
NAME                                        STATUS   ROLES    AGE   VERSION
ip-10-0-1-xxx.ap-south-1.compute.internal  Ready    <none>   5m    v1.32.x
ip-10-0-2-xxx.ap-south-1.compute.internal  Ready    <none>   5m    v1.32.x
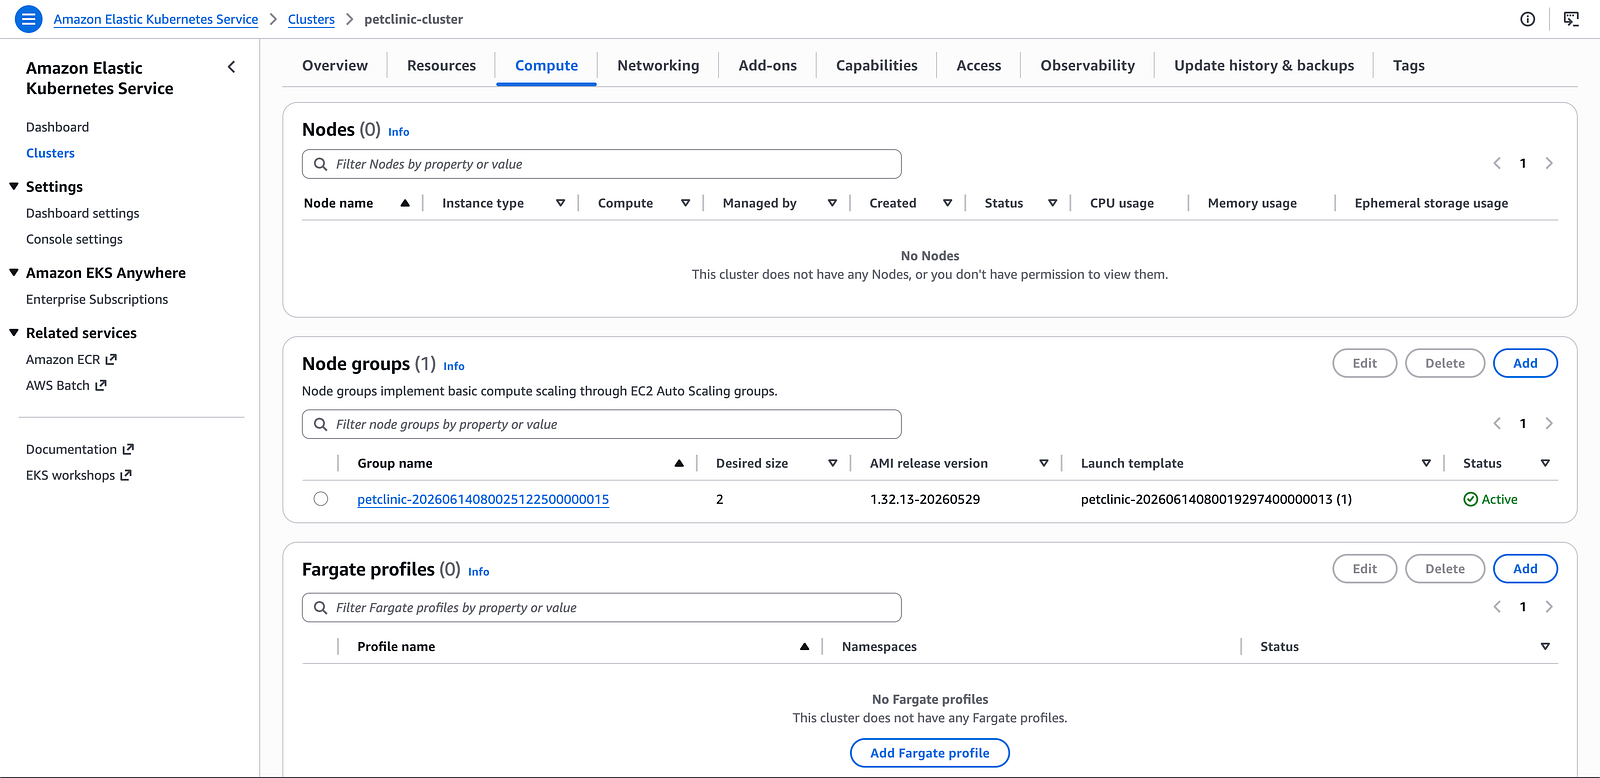
AWS EKS console — Cluster overview page showing petclinic-cluster Active
Terminal showing kubectl get nodes with both nodes Ready
Step 4: Push Docker Images to ECR
Login to ECR
aws ecr get-login-password --region ap-south-1 | \
  docker login --username AWS --password-stdin \
  721449410291.dkr.ecr.ap-south-1.amazonaws.com
Expected: Login Succeeded
Tag and Push Each Image
REGISTRY=721449410291.dkr.ecr.ap-south-1.amazonaws.com
docker tag springcommunity/spring-petclinic-config-server \
  $REGISTRY/petclinic/spring-petclinic-config-server:latest
docker push $REGISTRY/petclinic/spring-petclinic-config-server:latest
# Repeat for: discovery-server, api-gateway, customers-service,
# vets-service, visits-service, admin-server, genai-service
AWS ECR console showing all 8 repositories with images pushed

Step 5: Deploy to EKS with Helm
What is Helm?
Helm is the package manager for Kubernetes. Instead of writing 8 separate deployment YAML files, Helm uses templates — one deployment template that loops over all services and generates the Kubernetes manifests automatically.
Install ALB Controller (for public access)
The ALB controller watches for Kubernetes Ingress resources and automatically creates AWS Application Load Balancers:
helm repo add eks https://aws.github.io/eks-charts
helm install aws-load-balancer-controller eks/aws-load-balancer-controller \
  -n kube-system \
  --set clusterName=petclinic-cluster \
  --set serviceAccount.annotations."eks\.amazonaws\.com/role-arn"=<IRSA_ROLE_ARN>
Create the OpenAI Secret
The GenAI service needs the OpenAI API key as a Kubernetes Secret — stored encrypted in etcd, not in any YAML file or image:
kubectl create secret generic openai-secret \
  --from-literal=OPENAI_API_KEY=your-key-here \
  -n petclinic
Deploy MySQL
kubectl create namespace petclinic
helm install mysql bitnami/mysql \
  --namespace petclinic \
  --set auth.database=petclinic \
  --set auth.username=petclinic \
  --set auth.password=petclinic
Deploy PetClinic with Helm
helm install petclinic ./helm/petclinic \
  --namespace petclinic \
  --set registry=721449410291.dkr.ecr.ap-south-1.amazonaws.com \
  --set imageTag=latest
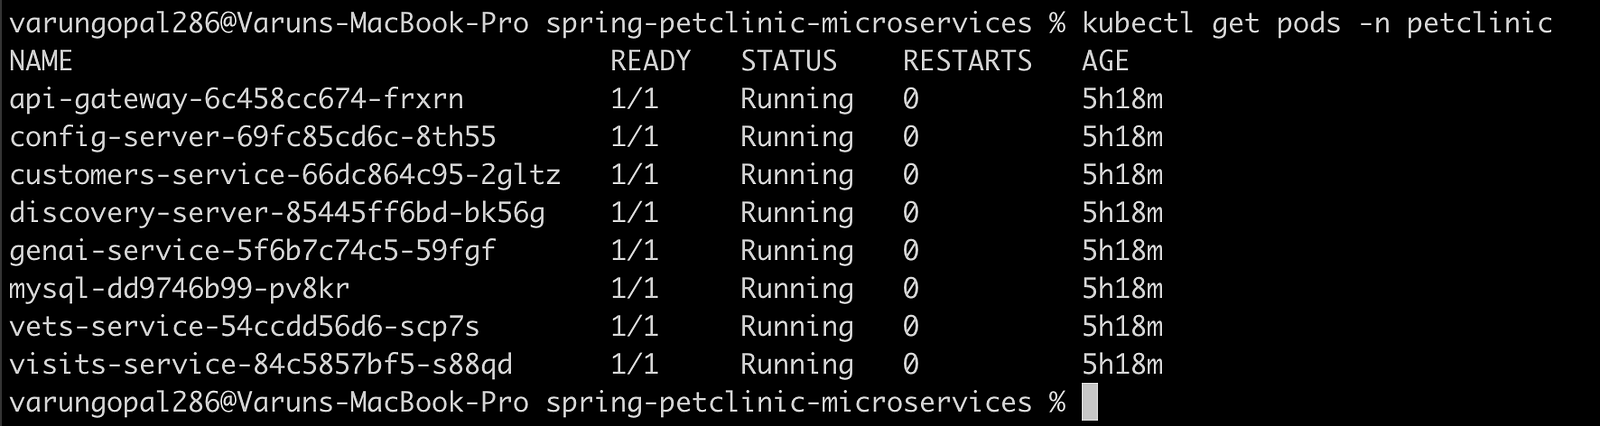
Verify All Pods are Running
kubectl get pods -n petclinic
Expected output:
NAME                               READY   STATUS    RESTARTS   AGE
api-gateway-xxxx                   1/1     Running   0          5m
config-server-xxxx                 1/1     Running   0          8m
customers-service-xxxx             1/1     Running   0          5m
discovery-server-xxxx              1/1     Running   0          7m
genai-service-xxxx                 1/1     Running   0          5m
vets-service-xxxx                  1/1     Running   0          5m
visits-service-xxxx                1/1     Running   0          5m
admin-server-xxxx                  1/1     Running   0          5m
Get the Public URL
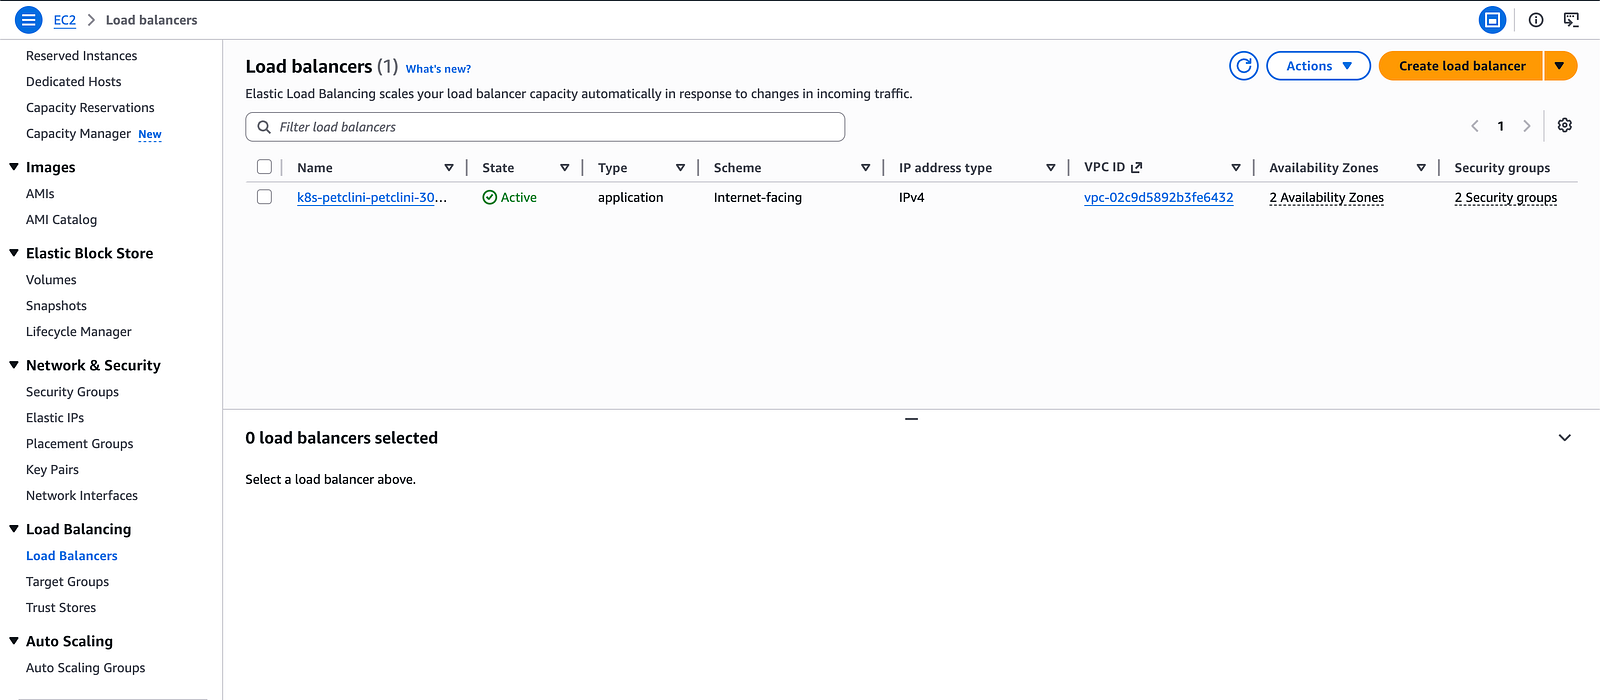
kubectl get ingress -n petclinic
The ADDRESS column shows your public ALB URL. Open it in your browser.
Load Balancers console showing the ALB Active
Step 6: GenAI Service — AI-Powered Pet Chat
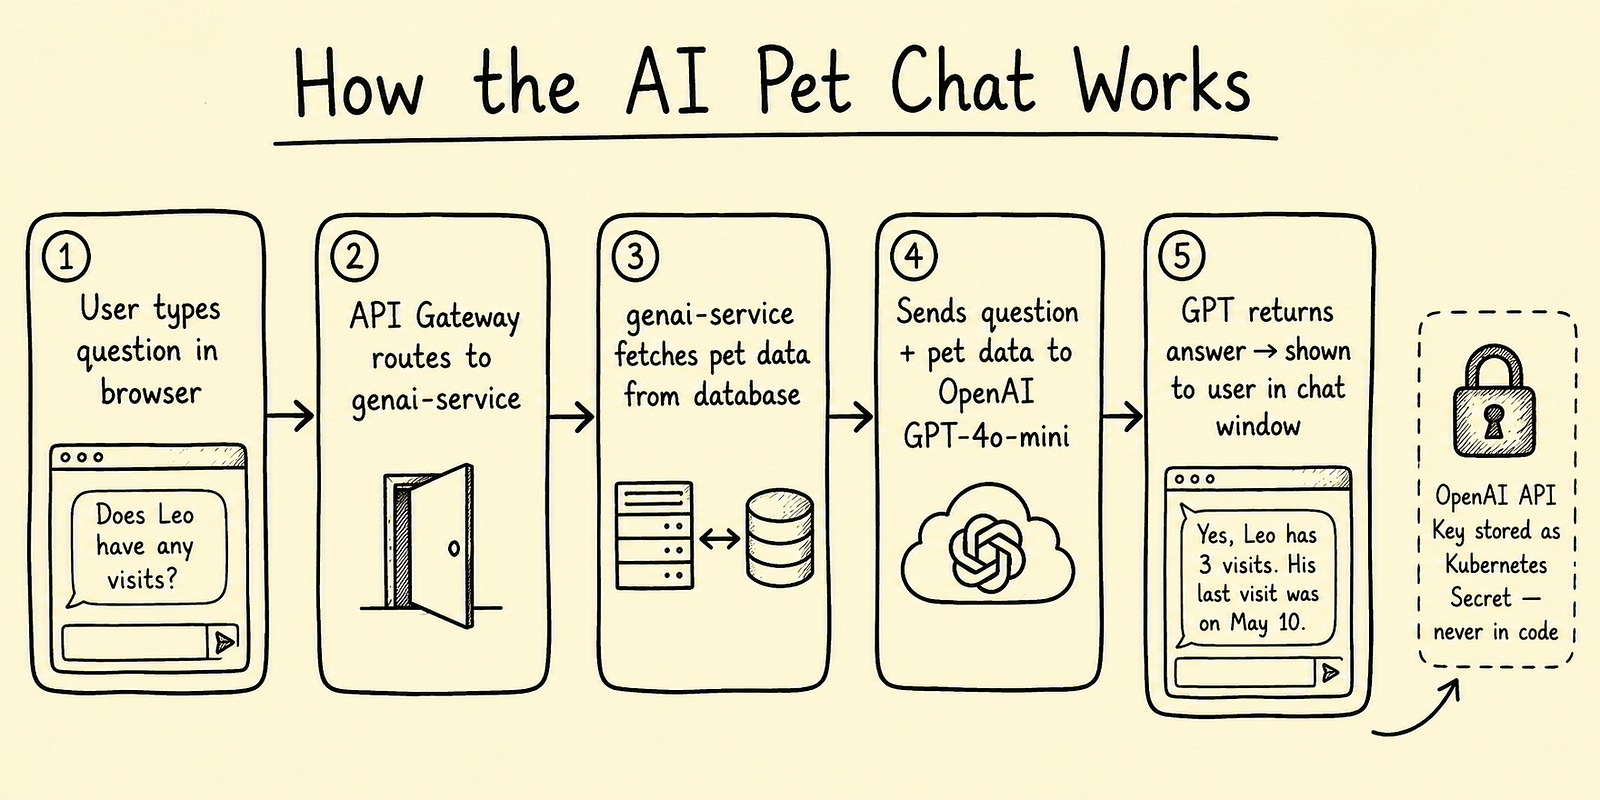
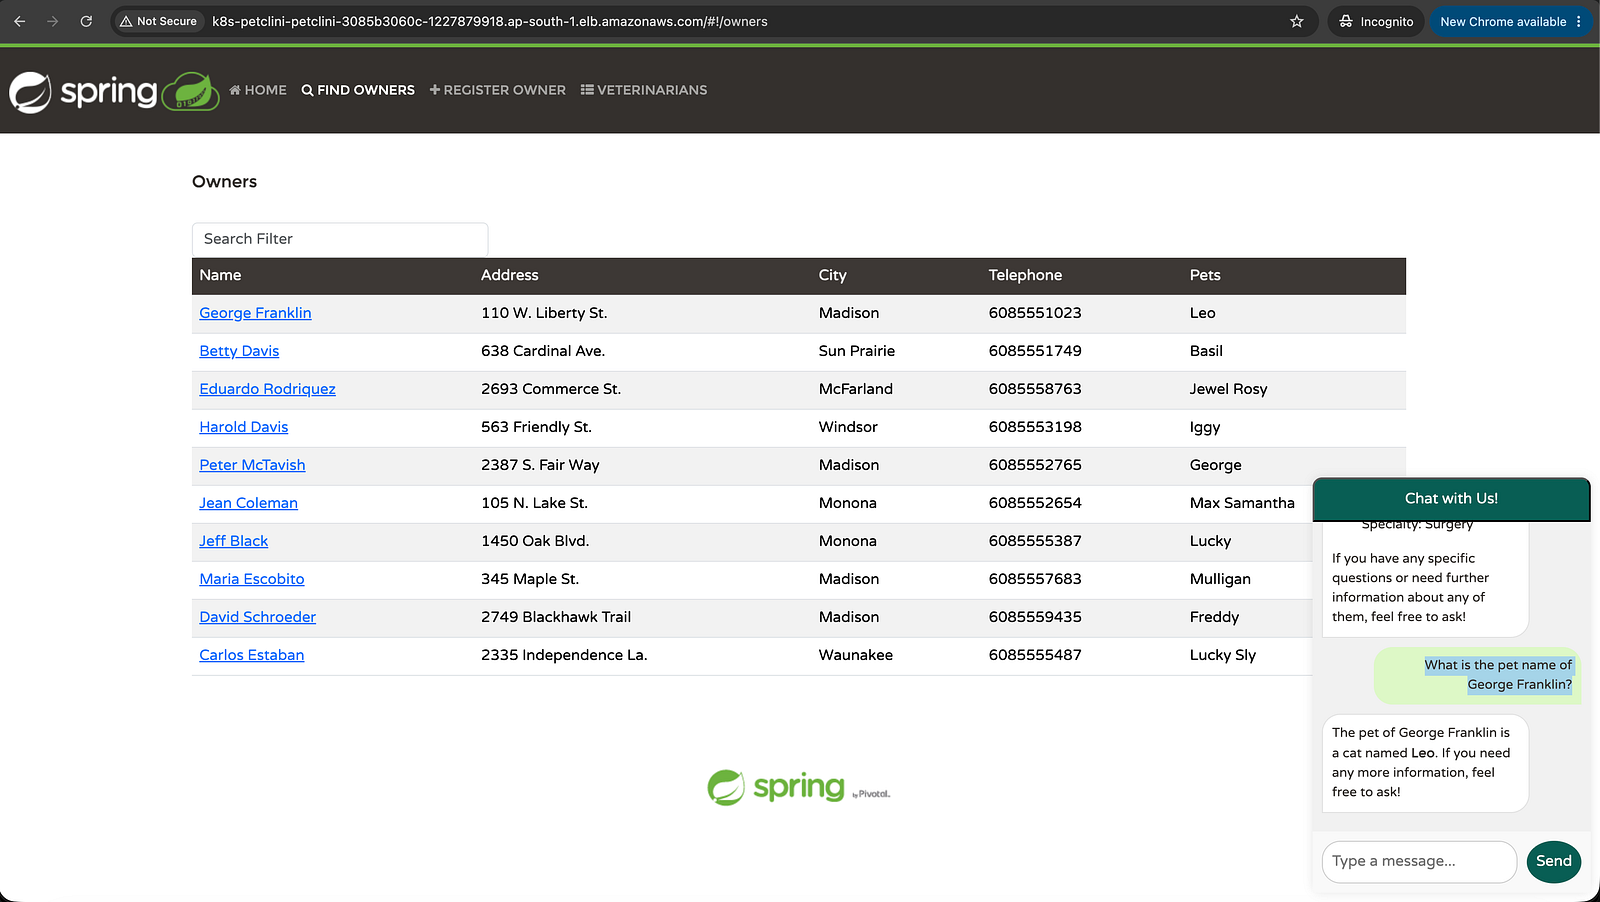
The genai-service connects to OpenAI GPT-4o-mini and lets you ask natural language questions about pets and vets in the system.
The API key is injected into the pod via a Kubernetes Secret — it never appears in any YAML file, Docker image, or GitHub repository:
# In helm/petclinic/values.yaml
genai-service:
  extraEnv:
    - name: OPENAI_API_KEY
      valueFrom:
        secretKeyRef:
          name: openai-secret
          key: OPENAI_API_KEY
Try it — go to the PetClinic UI → click "Ask our AI Assistant" → type:
"Does George Franklin's cat Leo have any upcoming visits?"
The service queries the database and answers using GPT.
Step 7: Observability — Prometheus, Grafana, and Zipkin
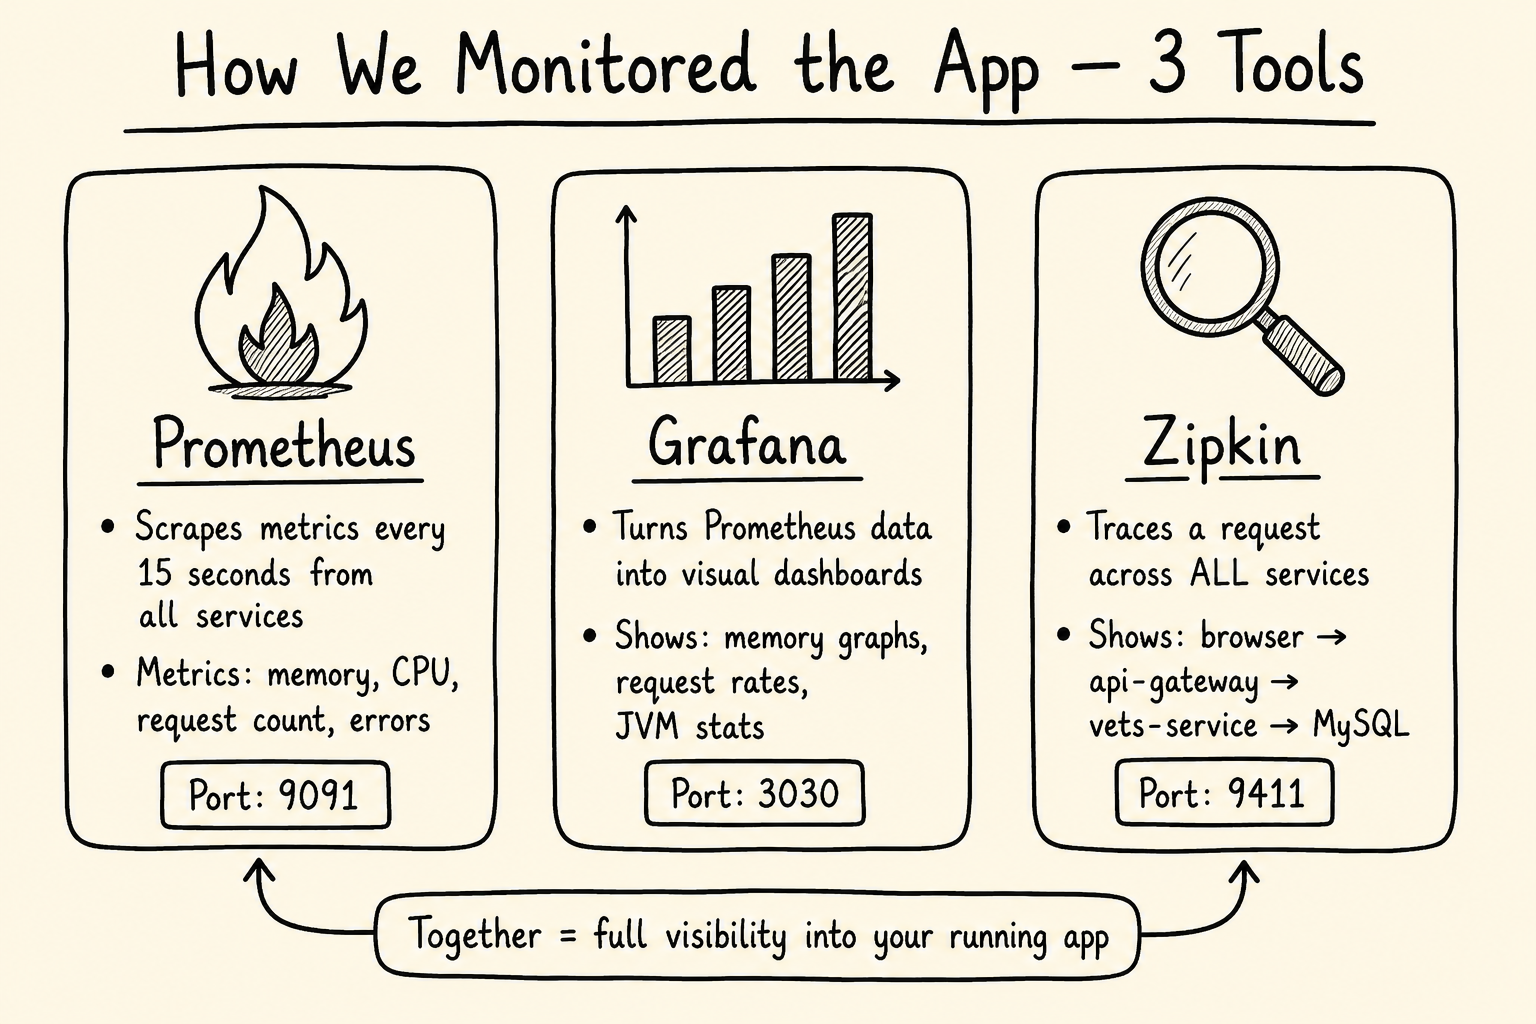
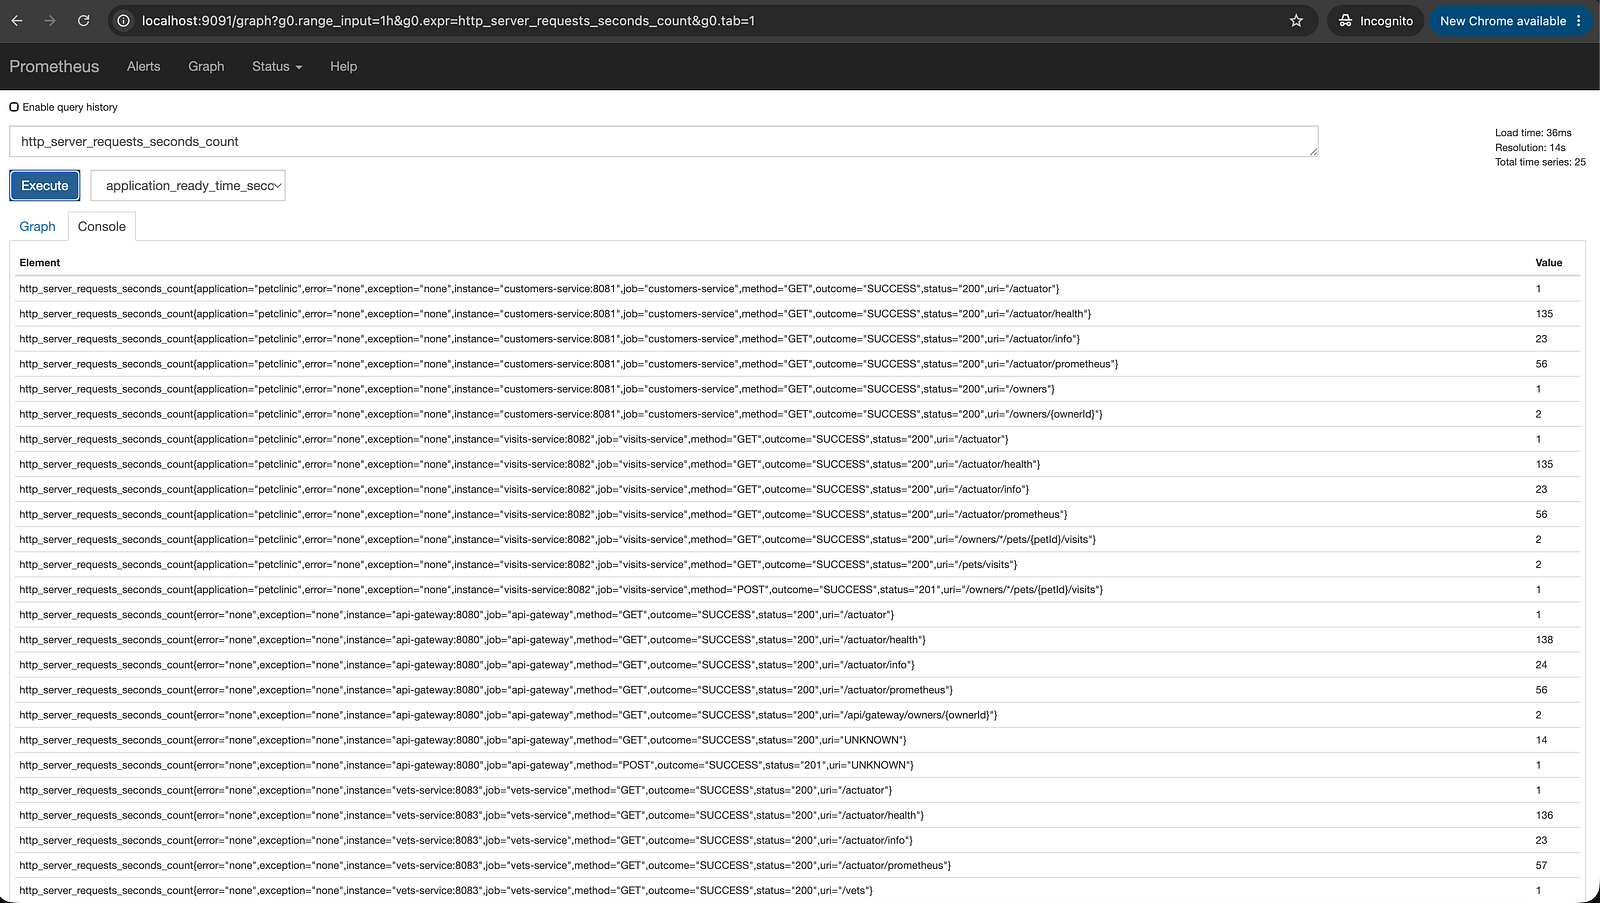
Prometheus
Prometheus scrapes metrics from all Spring Boot services via their /actuator/prometheus endpoint every 15 seconds. Metrics include:
JVM memory usage
HTTP request rate and latency
Active database connections
Garbage collection stats
Access locally at: http://localhost:9091
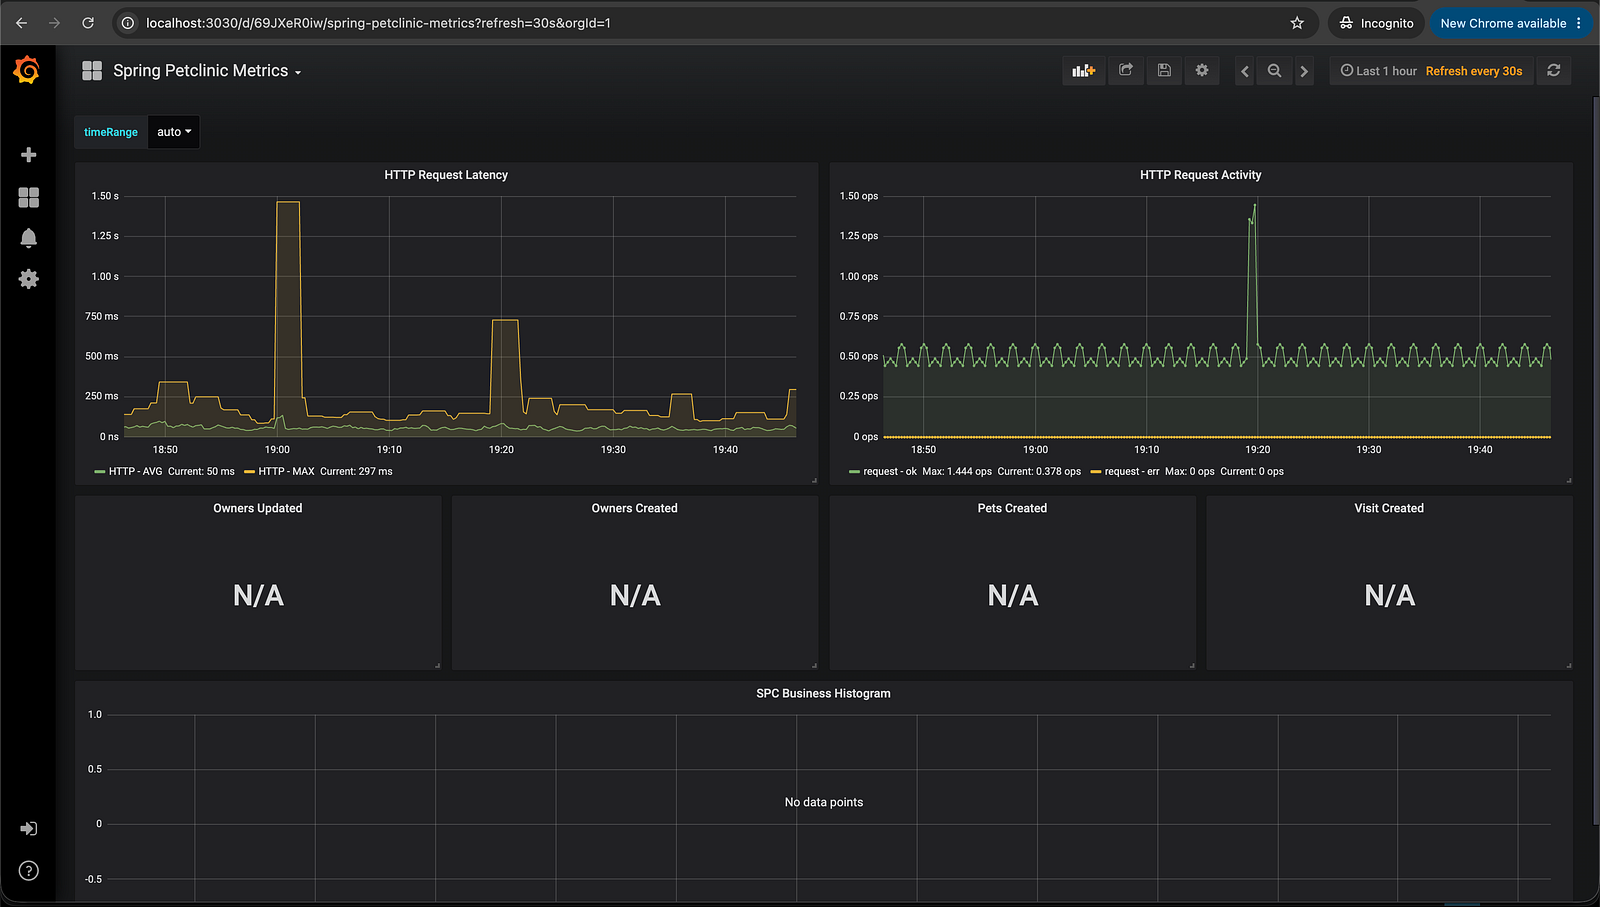
Grafana
Grafana visualizes the Prometheus metrics as dashboards. I used the pre-built Spring Boot dashboard (ID: 11378) which shows:
Memory usage per service
Request rate and response times
JVM thread count
Error rate over time
Access locally at: http://localhost:3030 (username: admin, password: admin)
Zipkin (Distributed Tracing)
Zipkin traces requests across multiple services. When a user searches for a vet, the request flows:
browser → api-gateway → vets-service → MySQL
Zipkin captures the full trace with timing for each hop so you can see exactly where time is being spent.
Access locally at: http://localhost:9411
Challenges I Faced (and How I Fixed Them)
ARM64 vs AMD64 — Platform Mismatch
Problem: My MacBook runs Apple Silicon (ARM64). The Spring PetClinic images are built for AMD64 (what AWS EC2 instances run). Pulling images without specifying the platform caused containers to crash silently.
Fix:
export DOCKER_DEFAULT_PLATFORM=linux/amd64
docker pull --platform linux/amd64 springcommunity/spring-petclinic-discovery-server
api-gateway Killed by OOM (Exit Code 137)
Problem: The api-gateway container kept crashing with exit code 137 (Out of Memory). Docker was killing it because it exceeded the 512MB memory limit.
Fix: Raised memory limits across all services in docker-compose.yml:
api-gateway:
  deploy:
    resources:
      limits:
        memory: 1024M  # was 512M
Also freed up memory by stopping other Docker containers running from unrelated projects.
Terraform Destroy Blocked by Orphaned Security Groups
Problem: After helm uninstall, two security groups created by the ALB controller were still attached to the VPC. Terraform couldn't delete the VPC because of these dependencies.
Fix: Manually identified and deleted the orphaned security groups:
aws ec2 describe-security-groups \
  --filters "Name=vpc-id,Values=vpc-02c9d5892b3fe6432" \
  --region ap-south-1
aws ec2 delete-security-group --group-id sg-09ad695898a268db6 --region ap-south-1
aws ec2 delete-security-group --group-id sg-08355334cbcb467bc --region ap-south-1
terraform destroy
⚠️ Lesson: Always run helm uninstall before terraform destroy. The ALB controller creates AWS resources outside Terraform's management — you must clean those up manually first.
Maven Build Failed — --load Flag Not Supported
Problem: The build script used docker buildx build --load which isn't supported in Docker 20.10.22.
Fix: Skipped rebuilding from source entirely. The official Spring PetClinic images on Docker Hub were functionally identical to what we needed. Tagged and pushed the pre-built images directly to ECR.
Grafana Not Accessible on Port 3000
Problem: Grafana wasn't loading at http://localhost:3000.
Fix: Ran docker ps and found Grafana was mapped to port 3030, not 3000:
0.0.0.0:3030->3000/tcp
The docker-compose.yml had 3030:3000. Always check docker ps output before assuming a port.
Key Takeaway
The single biggest lesson from this project: distributed systems fail in ways that single-service apps never do.
When you have 8 services, the question isn't if something will fail — it's which service failed, why, and in what order. Startup order, memory limits, platform architecture, network dependencies, secret management — all of these are non-issues in a monolith, but every single one of them hit me during this project.
What I'd change for a real production deployment:
Use Amazon RDS instead of in-cluster MySQL (data persistence, automated backups)
Add GitHub Actions CI/CD — auto-build and deploy on every push to main
Use AWS Secrets Manager instead of Kubernetes Secrets for the OpenAI key (rotation, audit trail)
Enable Cluster Autoscaler so nodes scale up under load and scale down to save cost
Add NetworkPolicies to restrict which services can talk to each other
Conclusion
In this project, I went from zero to a fully running microservices application on AWS EKS — locally with Docker Compose, and in the cloud with Terraform, ECR, Helm, and an Application Load Balancer. I connected a real AI service, set up observability with Prometheus and Grafana, and learned how distributed systems actually fail and recover.
If you're learning DevOps or cloud engineering, this kind of hands-on project teaches you more in a weekend than months of tutorial-watching.
GitHub Repository: https://github.com/varungopal286/spring-petclinic-microservices
If you found this useful, follow me on Hashnode for more hands-on cloud and DevOps content. Drop a comment below if you hit any of the same issues — happy to help.
This project was part of the DMI programme — a hands-on cohort-based experience where you build real DevOps and cloud skills in a team environment.
DMI Cohort 3 is starting 27 June — if you want to build real DevOps skills, apply here. Happy building!
